The Telemetry tab
What your agents are actually spending, pulled together live from every reachable node: sessions, time, tokens, and cost, with the breakdowns to see where it goes.
Local data, gathered on demand
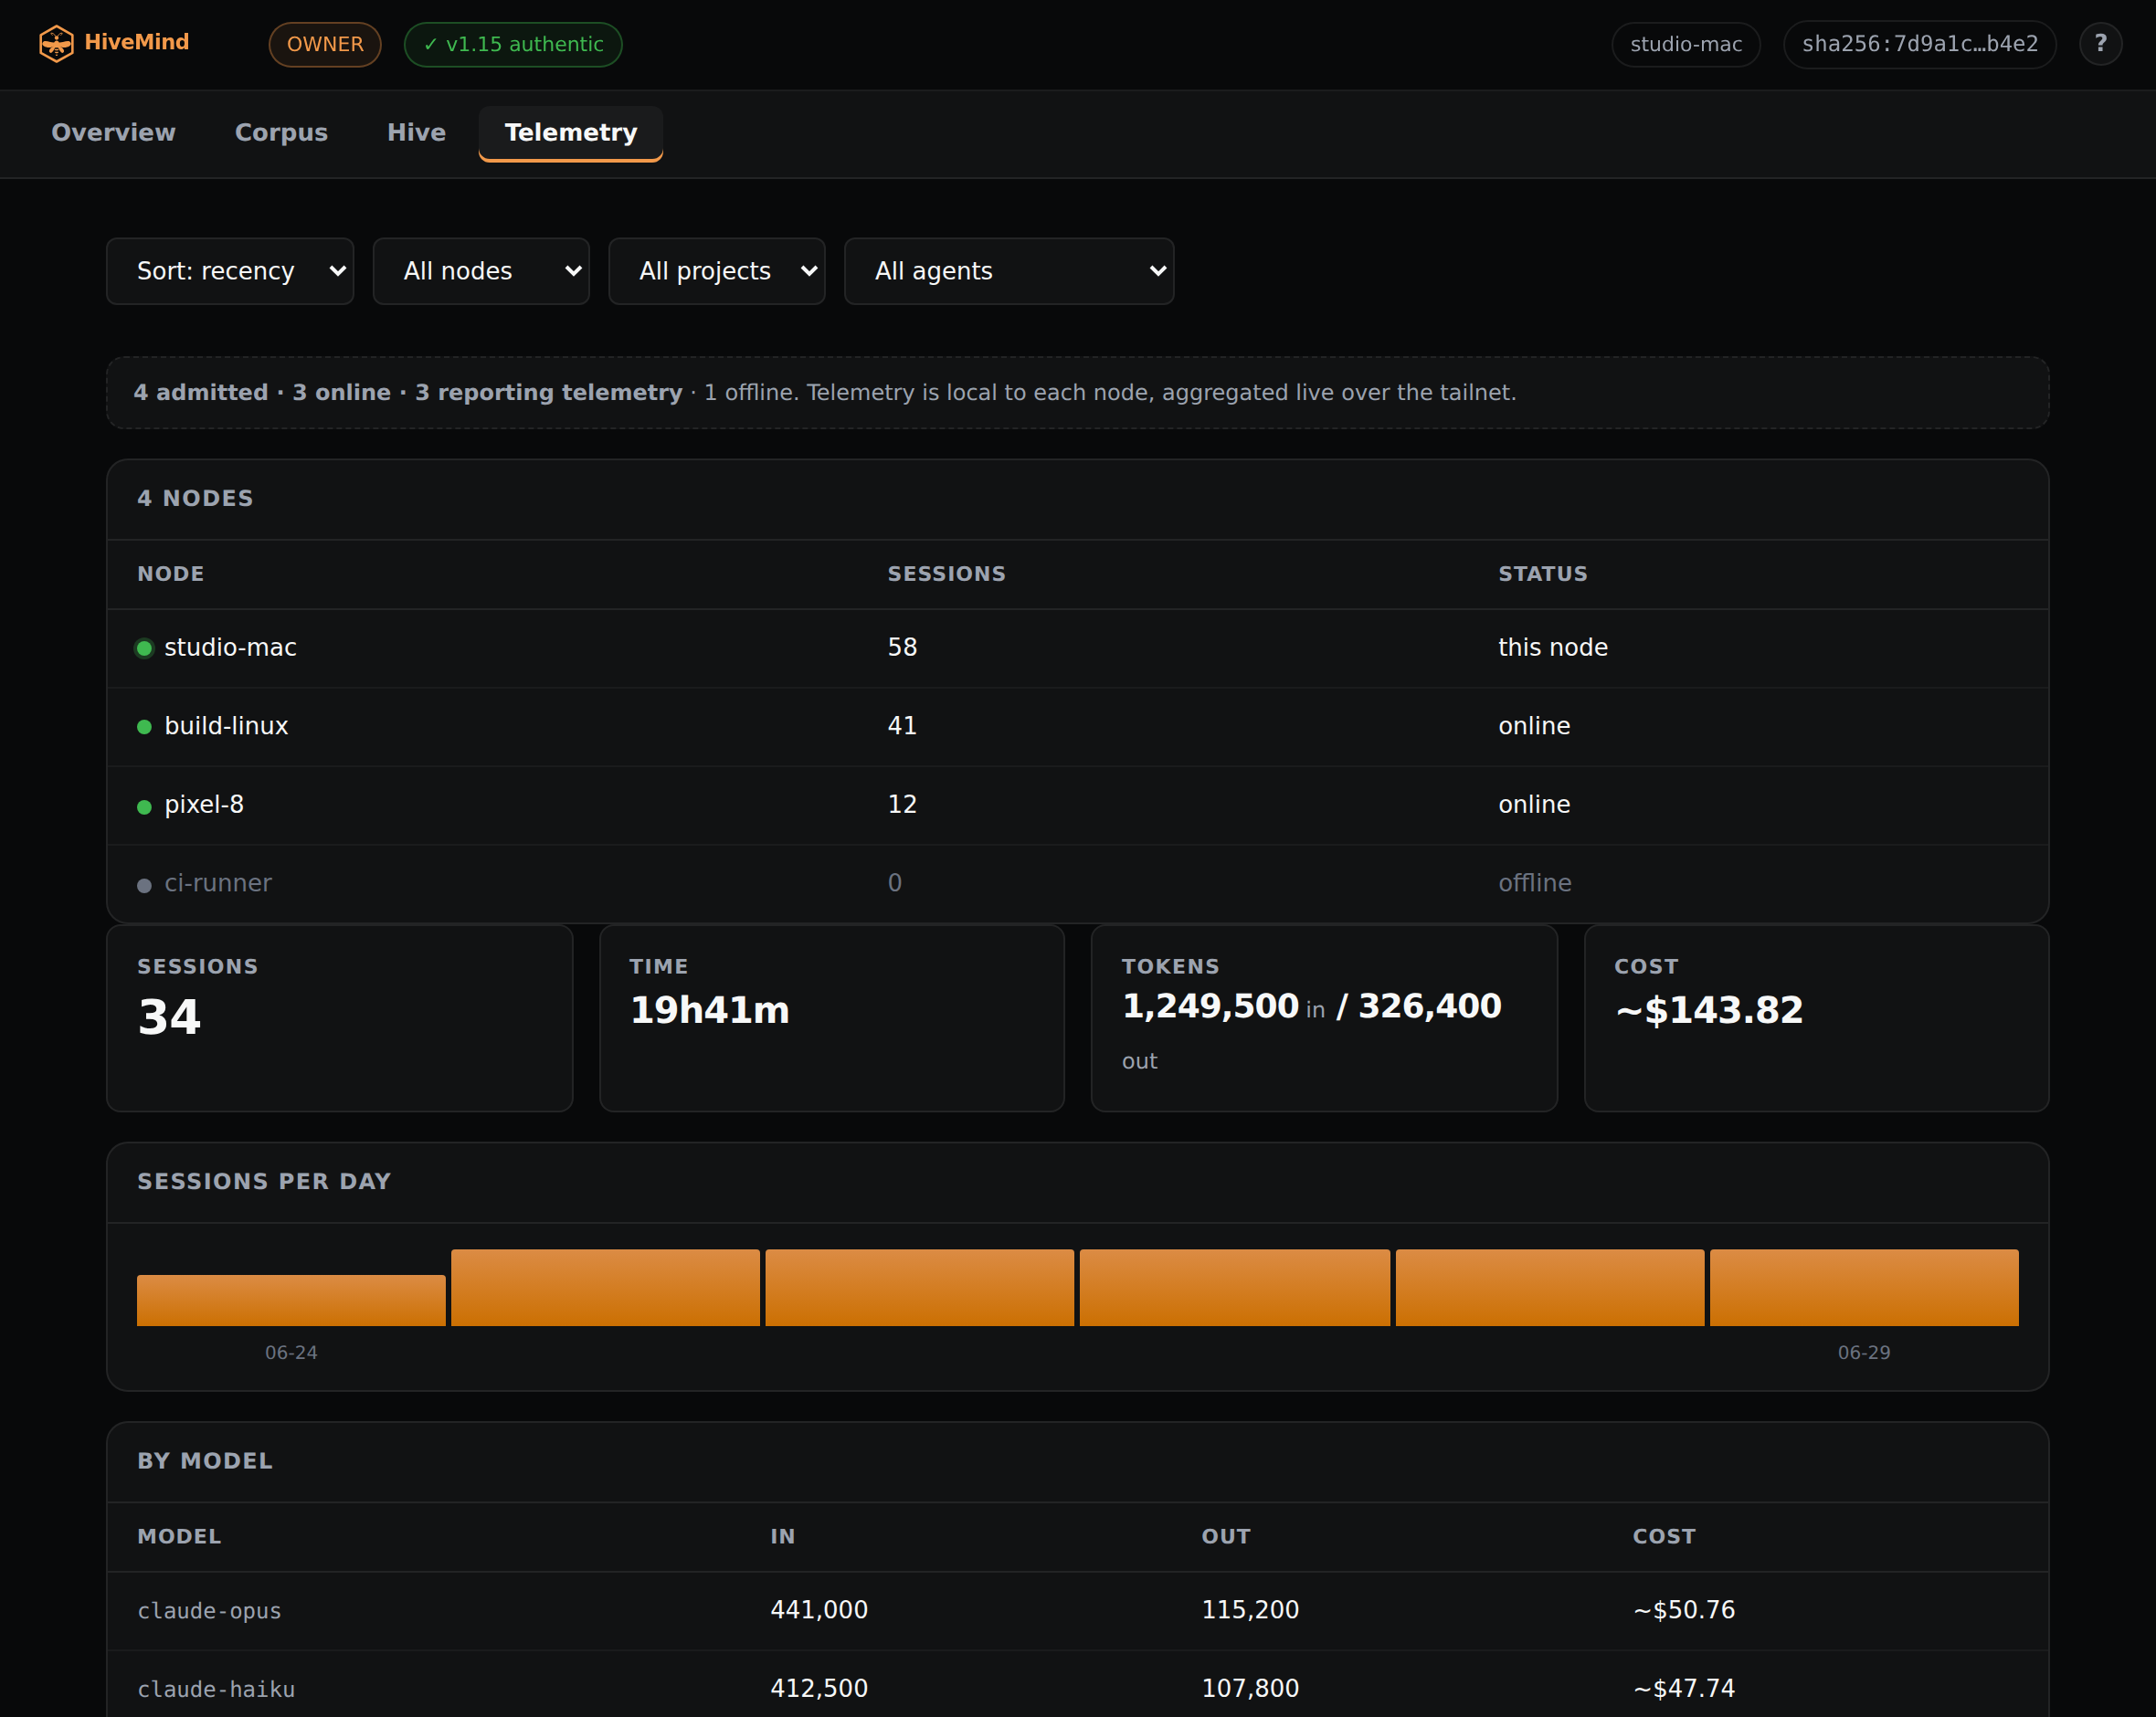
Each node keeps its own session telemetry locally, and it stays local: it is not written into the shared corpus. When you open this tab the dashboard reaches across the tailnet and gathers it, so you get one view of the whole hive without every device having to broadcast its usage. The totals cover sessions, time, tokens, and cost, with a per-day chart and a per-model breakdown.
Honest about reach
The header line says plainly what it could and could not reach, for example "4 admitted, 3 online, 3 reporting telemetry, 1 offline." An offline node has nothing to send, so the dashboard says so rather than showing a zero that looks like data. You always know whether you are looking at the whole hive or the part of it that answered.
Sort, filter, drill in
Sort by recency, cost, tokens, or duration. Filter by node, project, or agent to isolate a slice. Click a by-model row or a by-day bar to drill into it, or a single session to open its full record alongside other sessions from the same project. The numbers are a starting point you can move through, not a static report.
An observing view Read
Telemetry is something you watch, so this tab is read-only, like the rest of the dashboard. It lives only on your devices and never enters the shared journal.